One thing quickly became evident to me when I began developing Swytchcode: APIs are only as good as the developers’ experience using them. Workflows, testing, and documentation are all important, but what truly defines DevEx is how simple it is for a developer to find, comprehend, and utilize your API.
I’ve been considering analytics for developer experience a lot because of this. Real signals, not vanity metrics or simply “page views” or “clicks,” show where developers are stuck, what they’re exploring, and how well they’re transitioning from documents to code. I want to provide an overview of Swytchcode’s approach to this issue in today’s post. Additionally, I will discuss why analytics can offer valuable insights into your APIs that you might not otherwise have access to.
These days, you typically have to piece together several tools if you want to monitor how developers are utilizing your API. You may use documentation analytics to see which endpoints are being explored, Google Analytics to understand page interactions, support tickets or forum threads to identify reoccurring issues, and even API gateway logs to gauge actual usage. The process is disorganized and disjointed. My objective with Swytchcode is to consolidate the majority of these features into a single platform so that you can view your developer experience directly in one location rather than juggling five different dashboards. Let’s dive into the wonderful insights provided in Swytchcode.
Most common developer questions
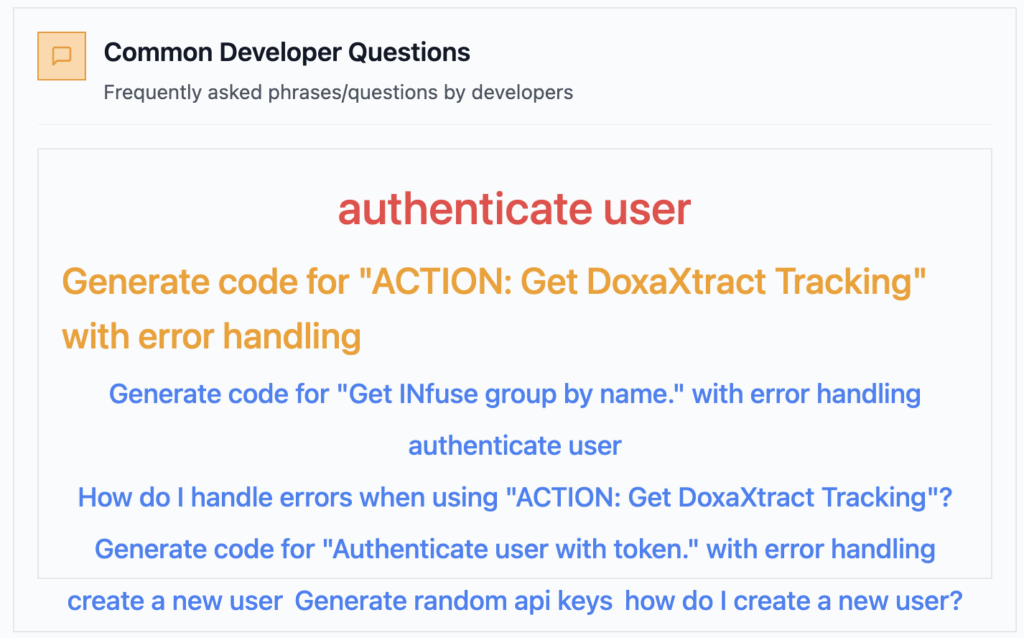
Teams can start by looking at the most frequently asked questions by developers. This appears as a word cloud in the Swytchcode Analytics Dashboard; it’s straightforward but surprisingly effective. Developers typically resort to Google searches, LLM inquiries, or forum browsing when they are unable to find the answers they need in the official documentation. When that fails, contacting support is the only remaining option, which typically entails waiting for responses and wasting valuable time.
The word cloud reverses that experience. It brings to light the real questions that developers ask most frequently, queries that typically indicate the workflows that they are attempting to accomplish. API teams can take those exact words and transform them into defined workflows inside Swytchcode rather than burying them in tickets or conversations. Future developers can see the workflows already recorded in the documents (with code, schemas, and steps), saving them the trouble of searching for solutions.
Read: The problem with current API documentation
Most commonly used programming language
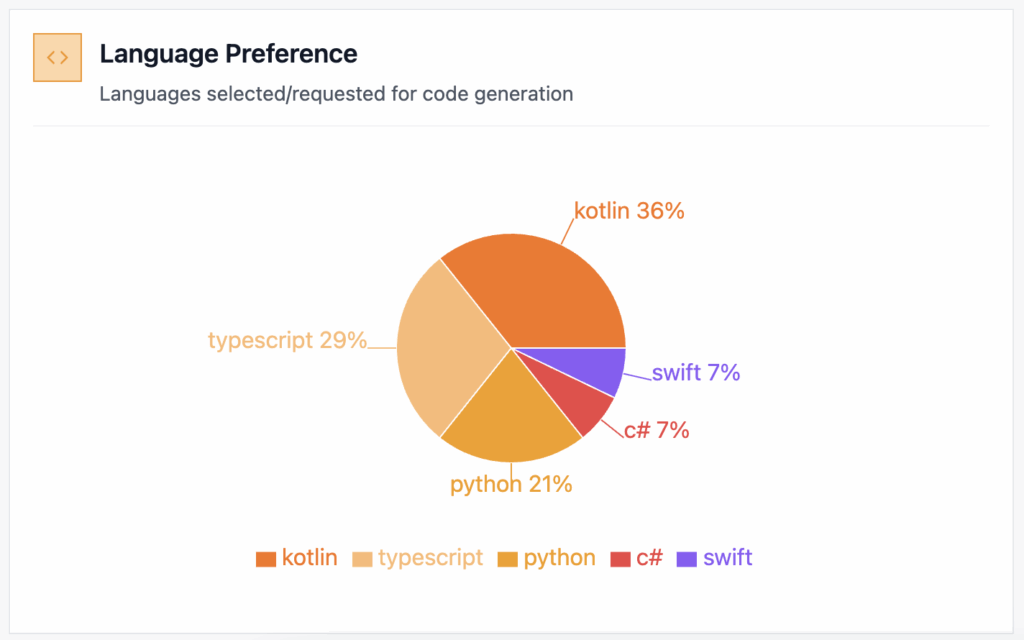
The most popular programming language is another indicator that I think is beneficial. Because different teams and developers have different preferences, usage patterns tend to focus on a small number of languages. Management can see which SDKs are really being used the most with Swytchcode Analytics.
Management interprets the usage rate as a signal, not just a numerical value. For example, if Python is the dominant language, it makes sense to invest in enhancing the Python SDK. Perhaps this could be achieved by incorporating improved methods and refining the documentation with more comprehensive examples. However, you can tell that a language like Go or Ruby is less important for quick fixes if it rarely appears in usage. These insights give you a clear method to allocate your resources where they will have the greatest impact on developers, instead of relying solely on chance.
Most commonly used workflows
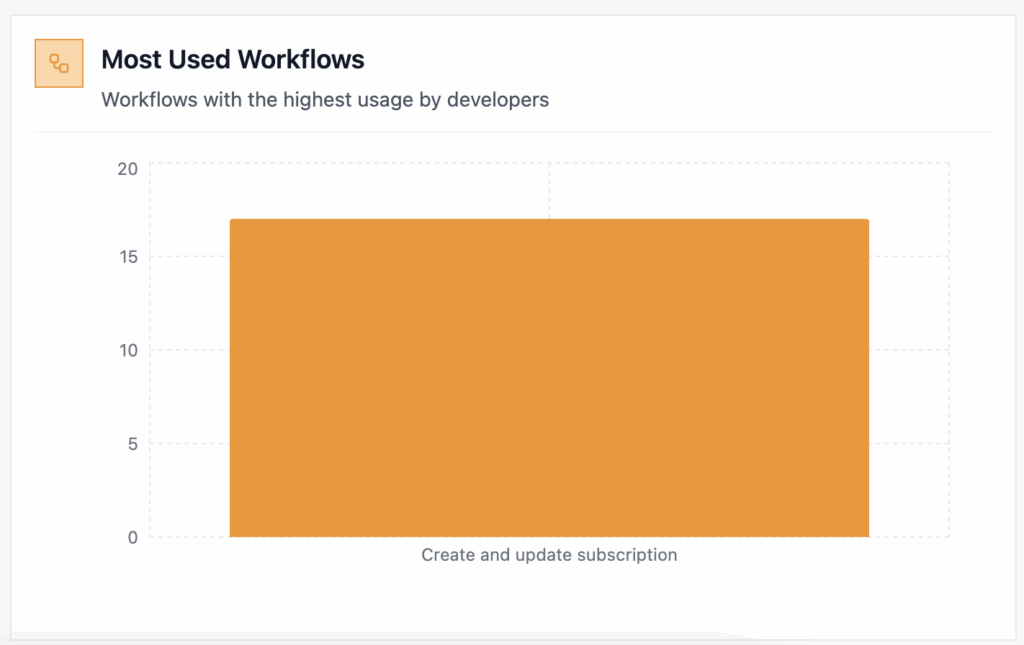
Next, let’s concentrate on the workflows that are most frequently utilized. These serve as the foundation for how developers use your API. Workflows that regularly stand out are obviously deserving of more attention. In reality, this entails providing them with comprehensive documentation that includes detailed explanations of inputs, outputs, error handling, and edge cases, in addition to endpoint references.
Moreover, API management teams can guarantee the comprehensive documentation of these workflows in the Swytchcode workflow definition. They can offer more thorough justifications, background information, and examples in the workflow description section. This not only benefits developers directly, but it also means that our AI will produce code snippets with more accurate comments and output that better reflects the workflow’s intent. Put another way, the more context you provide, the more benefit the AI and developers receive.
Most commonly used API endpoints
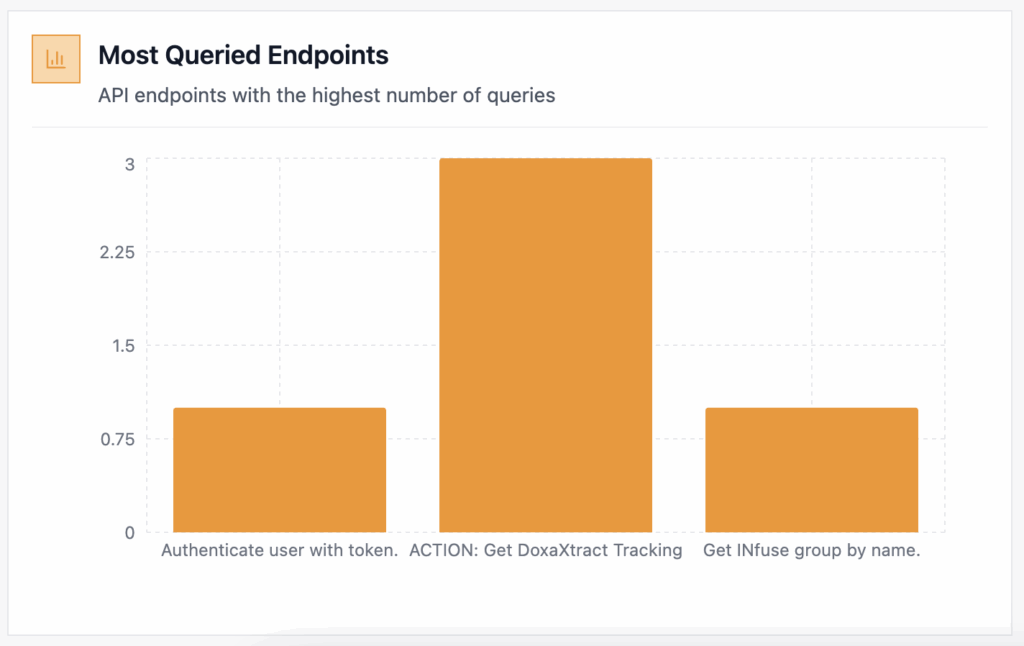
The most often used API endpoints are another area the teams can closely monitor. They can learn much more from this view than just the most popular endpoints. For instance, it is typically a sign that certain endpoints should be bundled together as a workflow rather than being left to be assembled by developers independently if they are frequently used in combination.
It also reveals the other side of the story—endpoints that receive no calls. Might they benefit from an update with improved examples and clearer documentation, or are they unnecessary and ready to be deprecated? They can get useful insights from both cases.
Of course, usage is insufficient on its own. Teams must also clearly define the inputs, outputs, and error handling of those endpoints. If developers are encountering frequent errors or experiencing difficulty handling parameters, it is evident that the documentation or SDK support requires improvement. These signals enable the management teams to continuously improve their APIs and developer experience.
Total monthly queries
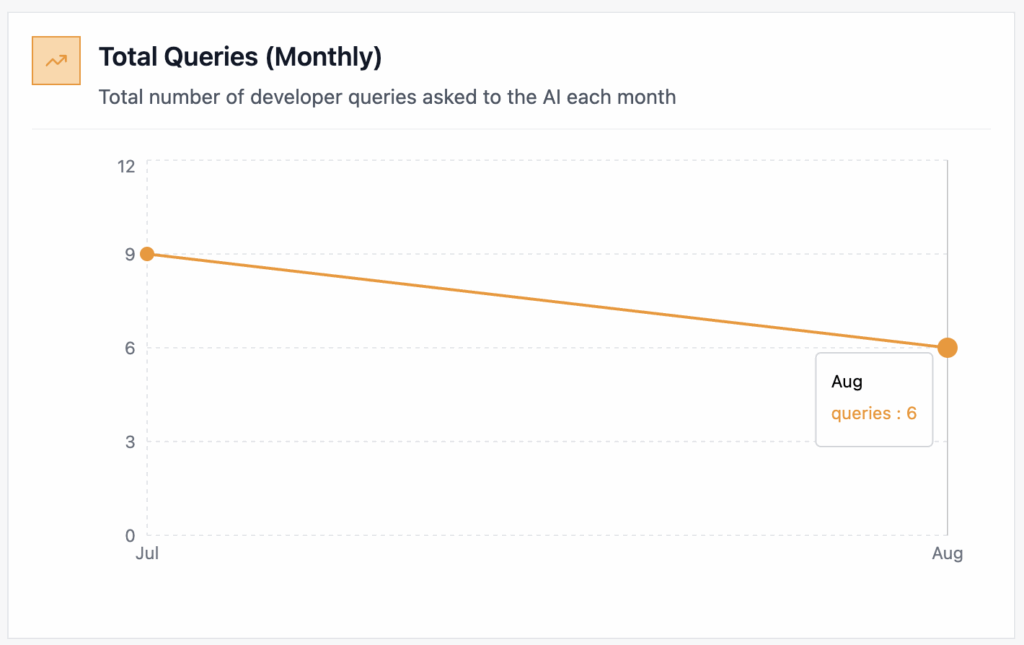
The most obvious indication of engagement, in my opinion, is the total number of monthly queries. It indicates whether developers are genuinely experimenting or merely perusing the documents. While a dip could indicate friction or a lack of clarity, a rising trend indicates more people are experimenting.
This metric also serves as an adoption tracker for management. Teams can immediately see if the usage of query numbers increases when a new feature is introduced or documentation is enhanced. It’s an effortless method to gauge the success of your DevEx endeavors.
Lastly, monitoring queries helps in predicting scaling requirements from an operations standpoint. Instead of being caught off guard, you can plan your infrastructure if queries are doubling every few months.
MCP key generation
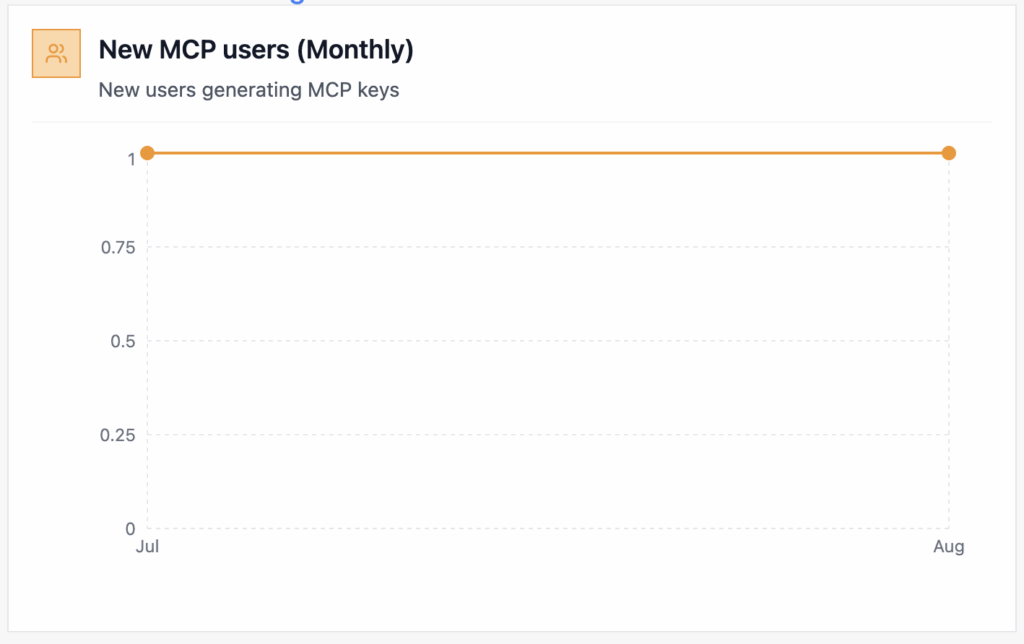
How many developers are actively integrating your API into their environments can be determined by looking at the quantity of MCP keys generated. It shows that the individual is dedicated to expanding upon your platform with the help of LLMs and is not merely perusing the documentation.
It informs the teams that the developers are interested enough to experiment with it in their code editors and with LLMs.
Read: Quickstart with Swytchcode MCP
Conclusion
Developer experience is ultimately something that must be measured; it cannot be inferred. I have been trying to illustrate this using various analytics points. Each signal helps to clarify what developers need and where they struggle, from the questions they frequently ask to the languages and workflows they use to the endpoints they actually use.
I want to gather all this data in one place with Swytchcode so teams can act on it instead of waiting for support tickets. Understanding the developer’s perspective is the first step towards creating better documentation, workflows, and SDKs. And creating APIs that developers enjoy using becomes easier the more we do that.
Explore Swytchcode app here: https://app.swytchcode.com


